| Share/Comment | |||
 |
Tweet |  |
|
 |
Feedback |  |
|
The fishbone diagram is a graphical method for finding the root causes of an effect. The effect can be either a negative one, such as a process defect or an undue process variation; or a positive one, such as a desired process outcome. Kaoru Ishikawa, a famous Japanese consultant developed this method in the 1960s. It is also known as "Cause-and-Effect Diagram" or "Ishikawa Diagram". The balance chapter details the steps required to construct a fishbone diagram. The example effect to illustrate the concept is "high petrol consumption in a car".
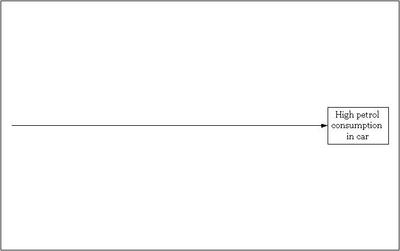
Step I
Identify the process effect to be analysed. Develop an Operational Definition to ensure that it is clearly understood. Write the effect in a box on the right side and draw a horizontal arrow from left to right that touches the box as illustrated in the figure below.
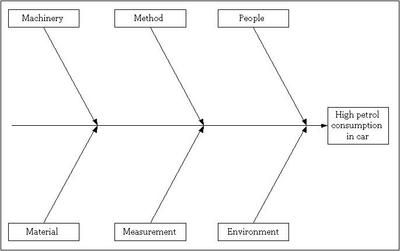
Step II
Identify the main categories of causes resulting in the effect under consideration. These categories can easily be selected from the applicable six key process elements. These process elements are people, environment, material, method, machinery, and measurement. Add selected categories in the diagram as illustrated in the following figure.
Step III
Identify as many causes under each category and add them to the corresponding category. Detail each cause further (recursively) to the lowest level possible.
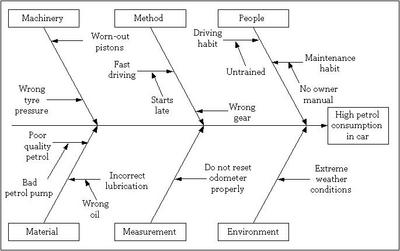
Analyse this diagram to identify the causes that require deeper investigation. As fishbone diagram identify only potential causes, it may be a good idea to use a Pareto Chart to determine the cause(s) to focus on first.
comments powered by Disqus
Commenting Guidelines
We hope the conversations that take place on “discover6sigma.org” will be constructive in context of the topic. To ensure the quality of the discussion stays in check, our moderators will review all the comments and may edit them for clarity and relevance.
The comments that are posted using fowl language, promotional phrases and are not relevant in the said context, may be deleted as per moderators discretion.
By posting a comment here, you agree to give “discover6sigma.org” the rights to use the contents of your comments anywhere.