| Share/Comment | |||
 |
Tweet |  |
|
 |
Feedback |  |
|
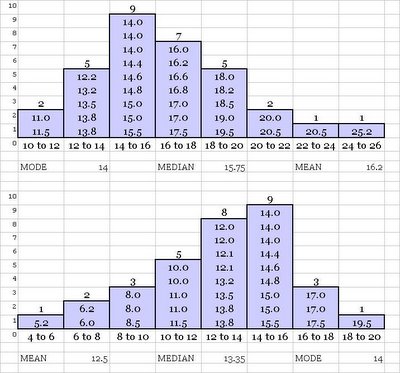
Simply stated, central tendency is a kind of middle point of a distribution and dispersion is the degree of scatter or spread of the data. There are several measures of central tendency. We will explore three such measures - median, mode, and mean. We will continue with our pizza shop example to develop a clear understanding of these characteristics.
Median
It is the middle most data item in the entire ordered or sorted data set. Finding middle point in data set with odd number of items is easy; it is simply (n + 1)/2 th item. In case of even number of items, the median is the sum of the two middle points divided by "2". In our pizza shop example, median is (14.0 + 14.4)/2 or 14.2, because in this case number of data items are even.
Mode
It is the data value that is found or repeated most often in the data set. In our pizza shop example, it is 14.0 as it is found four times i.e. the maximum in the data set.
Mean
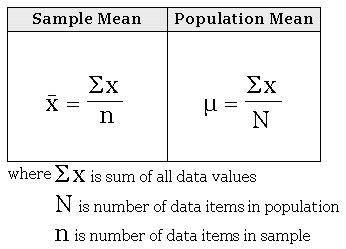
Often referred as average, it is the sum of all data values divided by total number of data items. In our pizza shop example, mean is 14.4. Following table illustrates the mathematical formula for mean.
If we only have a frequency table, then we assume that the mean value of each range (or class) appears in the data set "its frequency" times. The mean value of range is computed by adding the upper & lower value and by dividing it by "2". The formula to arrive at mean becomes:
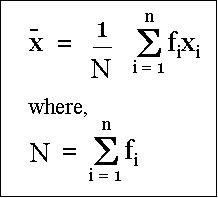
Here "n" is the number of classes (or ranges), "f" represents the frequency of data item "x". Note ith "x" is mean value of ith class (or range).
Very simple, isn't it? Looks like that we have understood all about mean, mode and median. No, not really! We need to develop a deeper and clearer understanding of these concepts, as they are the founding principles of Statistics (also Six Sigma). To do that, let us go back to our childhood and recall seesaw.
As long as we had a partner of similar (ideally identical) weight, we could easily sit equidistant from the center and enjoy. If there was a significant difference in our weight, we needed to adjust our respective distances from the center. The heavier child sat closer to the center compared to the lighter child. Recall, if heavy and light child sat equidistant from the center, the lighter child always remain hung in the air!
We understood all these tricks in our childhood by simple common sense. We later also learned the physics behind it. The 2 key concepts involved are center of gravity (or center of mass) and moment of mass.
Center of gravity is the position at which the mass "balances" without loosing balance or tilting to the left or right.
Moment of mass is always determined about a point. It is the tendency of the mass to contribute a torque or in other words make the object rotate (about a point).
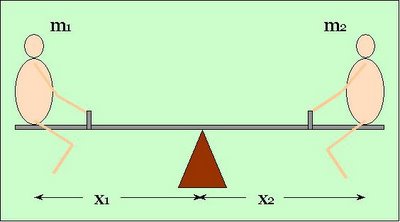
Putting it formally, in this seesaw to play perfectly we needed "m1.x1 = m2.x2". Here "m" denotes mass and "x" denotes distance of child from center. The suffix 1 & 2 are identifying child-1 and child-2. The center point in the above picture is the "center of gravity" and "m1.x1" and "m2.x2" are the "moment of mass" for children.
These principals hold good if there are multiple children sitting on each side of the seesaw. Look at the following figure.
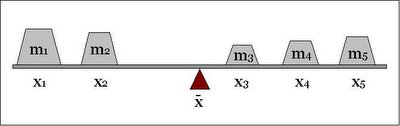
This time "x" is denoting the coordinates instead of the distances. Therefore, for balance it is important that the following holds true:
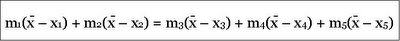
Now, it is time to build a formal picture. Imagine that there are 1 to n masses distributed across our seesaw. We can now easily understand the following sequence of equations.
With this conceptual background, it should now become easy for us to visualize the following facts. In any symmetrical frequency distribution, mean, mode and median are always at the same point. However, if there is a skew scenario changes. Look at the following figure:
In case of positive skew (as shown in first figure), the mode is at the peak of the distribution, the median is to the right of mode, and the mean is to the right of both - mode & median. In case of negative skew, scenario reverses.
| Share/Comment | |||
|
Tweet | |
|
|
Feedback | |
|
Important Observations about Mean, Mode, and Median
- Median is usually not applicable to qualitative data.
- Mode is useful for a) qualitative data, b) quantitative data having skewed distribution where considering all data points (or observations) is not important and focus is on the "typical value". In a multi-modal data situation, it may begin to loose meaning.
- Mean is useful wherever it is important to consider all data points or observations (total is important).
- Therefore, the extreme values in the data set impact the mean. Weighted mean should be considered, if relative importance of each data point or observation has to be accounted.
comments powered by Disqus
Commenting Guidelines
We hope the conversations that take place on “discover6sigma.org” will be constructive in context of the topic. To ensure the quality of the discussion stays in check, our moderators will review all the comments and may edit them for clarity and relevance.
The comments that are posted using fowl language, promotional phrases and are not relevant in the said context, may be deleted as per moderators discretion.
By posting a comment here, you agree to give “discover6sigma.org” the rights to use the contents of your comments anywhere.