| Share/Comment | |||
 |
Tweet |  |
|
 |
Feedback |  |
|
Box Plot provides an intuitive graphical representation of the five number summary of a dataset. The five number summary consists of Minimum, Q1, Q2 or Median, Q3, and Maximum of a dataset. John W. Tukey introduced the concept of Box Plot in his book Exploratory Data Analysis, published in 1977. It is also referred as Box & Whisker Plot.
Let us understand the power of box plot through a series of examples; the following example shows the box plot along with the sample data.
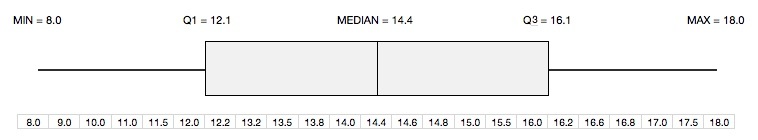
The box represents the inter quartile range (IQR = Q3-Q1) where its left border (also called hinge) corresponds to the first quartile (Q1) and the right border corresponds to the third quartile (Q3). Therefore, the middle 50% of data values fall within the box. The line in the middle represents the median of the data. The left whisker represents the smallest 25% of data values with its left most end corresponding to the minimum value of the data. Similarly, the right whisker represents the largest 25% of data values with its right most end corresponding to the maximum value of the data.
Let us look at the second data set and the corresponding box plot. The data has been superimposed on the histogram with box plot aligned perfectly on the top to give you a crisp and easy to understand picture.
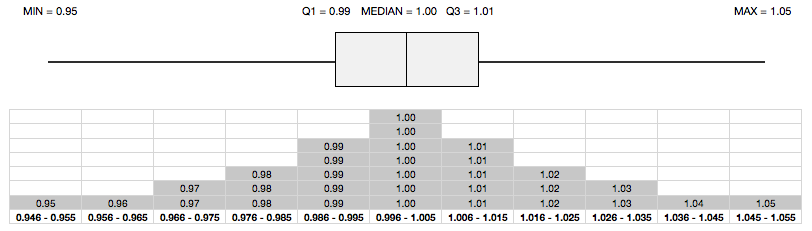
The histogram in the figure clearly suggests that,
- It has no skew implying that it has symmetrical distribution.
- It has long tails i.e. it possibly has outliers.
Now, it is time to look at the box plot. Notice that both the whiskers are much longer than the length of the box (IQR) - an indication of the possible presence of outliers. In fact, Tukey suggests that an outlier is a point that is greater than or less than 1.5 times the IQR. Here is the same box plot, but with outliers (0.95 and 1.05) clearly highlighted as per Tukey's recommendations.
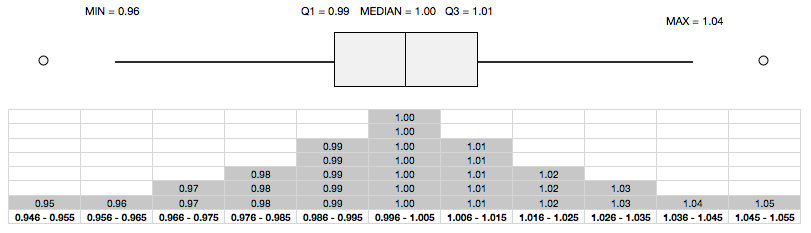
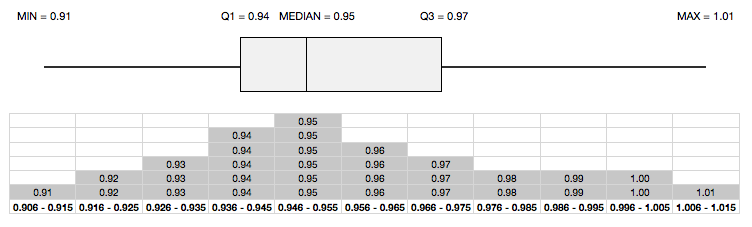
The above box plots (with or without outliers) also reveal that the two whiskers are of equal length and the median lies right in the middle of the box - an indication of symmetrical distribution. Any deviation from this leads to a non-symmetrical distribution, as illustrated in the following box plot.
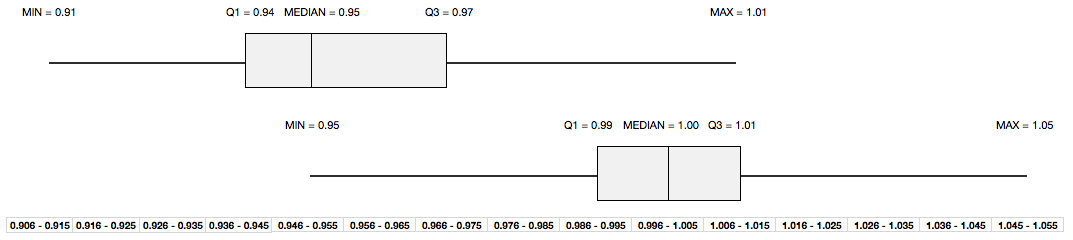
Box plot also serves as a great way to quickly compare two or more series by juxtaposing the box plots of the series to be investigated. The following plot shows the previous two box plots juxtaposed clearly to highlight the differences (or similarities) in central tendencies and dispersions.
Important Observations
- Box plot is based on robust statistics, i.e. it is more tolerant (or robust) to the presence of outliers.
- It gives an indication of shape of distribution in terms of symmetry or skewness.
- It is an excellent means to determine if there are similarities (or differences) between two or more data sets by juxtaposing their box plots.
comments powered by Disqus
Commenting Guidelines
We hope the conversations that take place on “discover6sigma.org” will be constructive in context of the topic. To ensure the quality of the discussion stays in check, our moderators will review all the comments and may edit them for clarity and relevance.
The comments that are posted using fowl language, promotional phrases and are not relevant in the said context, may be deleted as per moderators discretion.
By posting a comment here, you agree to give “discover6sigma.org” the rights to use the contents of your comments anywhere.