| Share/Comment | |||
 |
Tweet |  |
|
 |
Feedback |  |
|
Descriptive Statistics is one of the simplest techniques used in quality management to obtain a meaningful insight into the data being analyzed.
Let us take a few examples. It makes sense to build a frequency table of complaints by categories from the raw data on complaints from different customers. It clearly tells us the top few complaints that need immediate attention. On the other hand, it would be preferable to compute the average or mean from loan processing time data of thousands of applications from a bank to find out the average turnaround time required to process any application. This can subsequently be compared with industry average to benchmark bank's performance.
Data types tell us how we can gain meaningful insight in the data – this could be achieved by computing mean or by building frequency table or by using other summary measures such as mode or median. Therefore, it is important to understand the type of data being analyzed to determine what summary measures are applicable to obtain a meaningful insight. Recall that there are two types of data - quantitative or numeric or scale, and qualitative or categorical or attribute. The categorical data can be in form of either ordered or unordered categories. Examples of unordered category data is marital status (e.g. single, married, widowed, or separated) or customer complaints data collected in our pizza shop example. Such data is also referred to as nominal data.
Ordered categorical data or ordinal data defines the values representing rank or order. For example, customer satisfaction in terms of unsatisfied, expectations met, exceeded expectations, and significantly exceeded expectations.
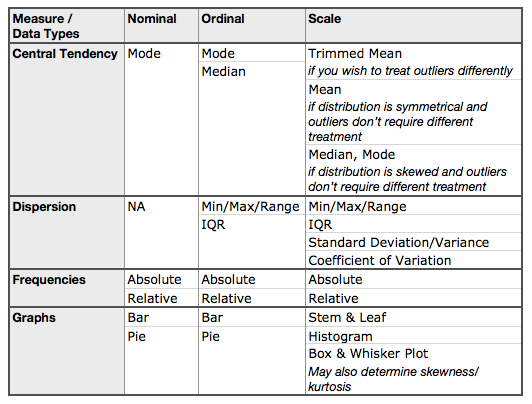
With this background of data it should be very easy to imagine that not all measures may be computed for a given data (type). For example, it does not make sense to compute mean of nominal data; imagine computing mean of marital status! In this case, mode is what will give us meaningful insight into the data. Following table summarizes the applicable characteristics and representations for each data type.

Note that outliers are extreme data values in a dataset that have significant numeric distance from the rest of the data. The presence of an outlier is usually an indication of an error in measurement or recording. Such data values impact mean and standard deviation directly.
Trimmed mean is computed after removing the fixed percentage of extreme upper and lower data values; typical percentage is 5%. Such a mean is resistant to outliers. Similarly in the case of dispersion, IQR is more resistant to outliers than the standard deviation or variance. This happens because IQR is the range of only the middle 50% of all data values.
Measures computed of a sample drawn from the population are referred to as statistics; when the same measure is computed for a population, it is called a parameter.
comments powered by Disqus
Commenting Guidelines
We hope the conversations that take place on “discover6sigma.org” will be constructive in context of the topic. To ensure the quality of the discussion stays in check, our moderators will review all the comments and may edit them for clarity and relevance.
The comments that are posted using fowl language, promotional phrases and are not relevant in the said context, may be deleted as per moderators discretion.
By posting a comment here, you agree to give “discover6sigma.org” the rights to use the contents of your comments anywhere.